
Presentation of the Best Practice
Target challenge
- Overexploited groundwater
- Move towards zero discharge at local level
- Other (Please specify below)
- water for recreational green areas is not available
Area Typology
- Urban area
Main beneficiaries
- Local Population
- Municipalities
- Other (Please specify below)
- water resources and energy resources users - i.e. all people
Impact on the beneficiaries of your Best Practice:
2 ha of parks and green recreation areas for a city of 10.000 inhabitants in an otherwise dry area.
Funding
- EU funding
- Private financing
Used technologies / tools
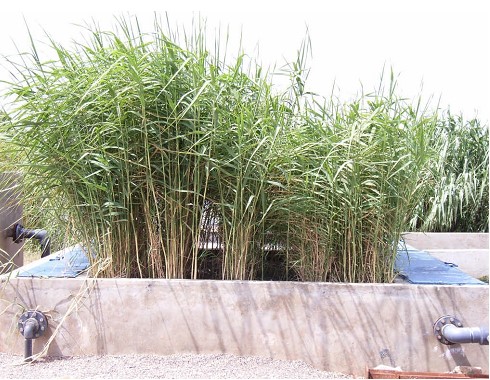
- CW
- separation of grey and black water, a constructed wetland for greywater treatment in an urban area
Implementation site
El Attaouia
NCW type
- Greywater (GW)
NCW USE
- Landscaping
- Recreation Area
Self-Assessment
TRL : Technology Levels
TRL8
Description of the innovative component:
The use of wetlands to treat greywater onsite in the middle of an urban area
Obstacles to implementation
- Other (Please specify below)
- Lack of training of professionals to take up best practices in their portfolio
Obstacles to funding
None
How your Best Practice is economically feasible ?
It brings a net benefit compared to buying freshwater for irrigationResult of this assessment
The water is reclaimed and would otherwise not be available at this site, the plant is economically highly feasible.Enviromental impact
SDGs
Validation/upscaling
No
Potentiel of exploitation/outscaling
There are 5000 hammams in Morocco, which could all have a similar greywater treatment. It could be implemented at all hammams wherever these are operated.
Lessons learnt
The pilot system worked satisfactorily, it provided NC water for green areas that would not have been avialable otherwise, but it was terminated for political/personal reasons 4 years after its start…
Recommandations
To the water reclamation at the hammam a solar heater was added, that provided half of the required energy for water heating. Such systems could be implemented at all hammams throughout the region,…
Highlighted KPI
Technical indicators
Average Treated flow rate
m3/Day
Average Reused flow rate100 m3/Day
Salinity27000 g/Day
Suspended solids SS1020 g/Day
COD7200 g/Day
Economical indicators
Average total Cost
euro/m3 terated/day
Without consideration of the depreciation period
Average O&M cost
euro/m3 terated/day
Average benefit of reuse
euro/Day
Land footprint
6.67
m2/m3/day


Social impact of the BP