Presentation of the Best Practice
Target challenge
- Overexploited groundwater
- Move towards zero discharge at local level
- Vulnerability to climate Change
Area Typology
- Urban area
- Other (Please specify below)
- Dense Urban
Main beneficiaries
- Municipalities
Impact on the beneficiaries of your Best Practice:
It provides approximately 30–40 tons of water savings per day in our municipality.
Funding
- National funding
Used technologies / tools
- Physical process
- Sedimentation
- Filtration
- Others
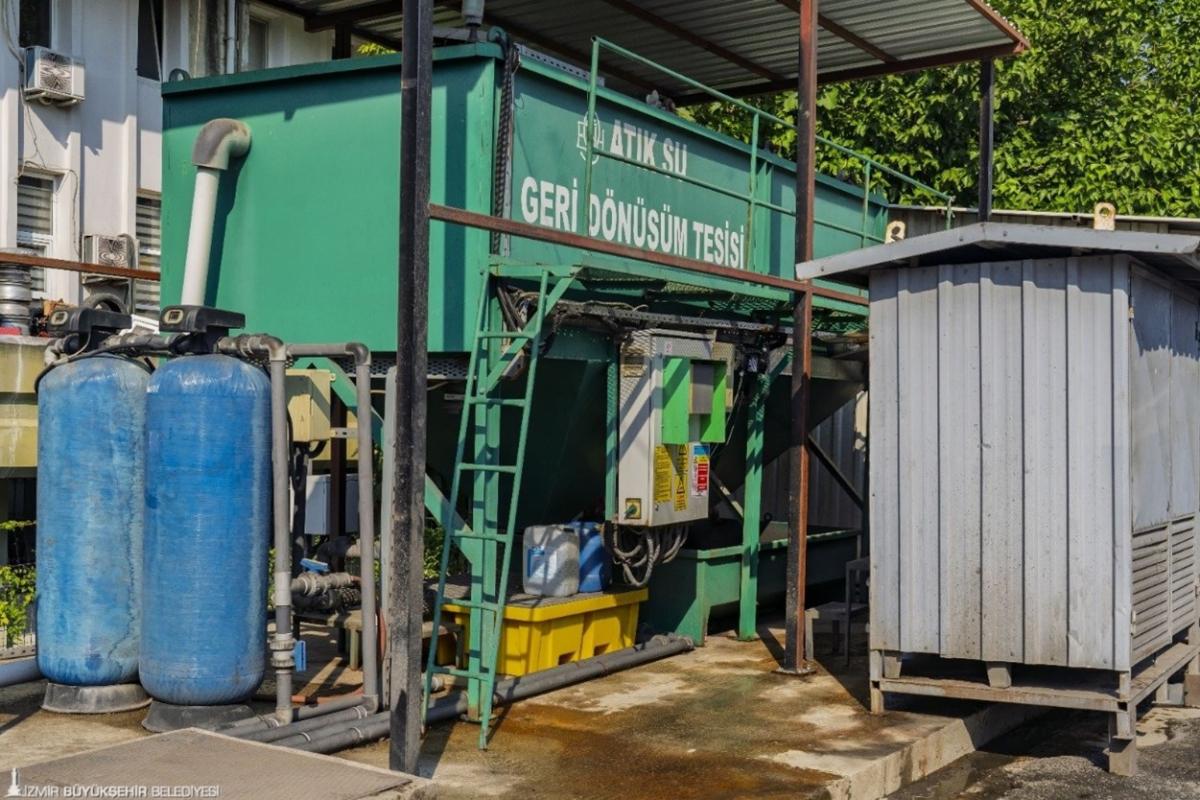
- • CT: Collection Tank;
- • ST: Sedimentation Tank;
- • pHAU: pH Adjustment Unit;
- • ACF: Activated Carbon Filter;
Implementation site
İzmir
NCW type
- Greywater (GW)
- Other
NCW USE
- Recycling
Self-Assessment
TRL : Technology Levels
TRL9
Description of the innovative component:
• Combining activated carbon filtration with water recovery.
• Creation of a closed-loop water cycle.
• Creation of a closed-loop water cycle.
Obstacles to implementation
- High cost of technological solutions
Obstacles to funding
There are no difficulties in accessing funding
How your Best Practice is economically feasible ?
The financial feasibility of the system is based on the principle of treating and reusing wastewater generated from public transportation vehicles washing operations. By reusing the recovered water in washing operations, municipal water consumption is significantly reduced. This not only saves the money on water supply costs but also reduces wastewater discharge costs. Thanks to the high water recovery rate, the system recoups its investment and operating costs within a certain period, creating an economically sustainable structure.Result of this assessment
The system was established in 2017. Since its installation, it has been used daily for washing buses. Periodic maintenance is carried out by municipal staff. It is a sustainable and trouble-free system.Enviromental impact
- Sludge discharge
SDGs
Energy consumption KWh/m3
1.50
Validation/upscaling
Similar applications have been implemented and are operational in other municipal bus washing garages in İnciraltı, Çiğli, and Torbalı.
Potentiel of exploitation/outscaling
Yes, there is potential and it is being implemented. Steps have been taken to establish similar systems in Urla and Adatepe bus washing garages.
Lessons learnt
The simple design of the system has ensured its sustainability. Regular maintenance and filter replacement are required, the operational status of the system must be monitored, chemicals should be…
Recommandations
Installation of similar systems integrated with rainwater and greywater is ongoing in other municipal bus garages. It is possible to further improve the system by supporting it with new technologies.
Highlighted KPI
Technical indicators
Average Treated flow rate
m3/Day
Salinity11250 g/Day
Suspended solids SS5250 g/Day
COD3787.5 g/Day
Economical indicators
Average total Cost
euro/m3 terated/day
Without consideration of the depreciation period
Average O&M cost
euro/m3 terated/day
Land footprint
2.67
m2/m3/day


Social impact of the BP
- Other (Please specify below)
awareness on water recycling and conservationJobs created
Jobs created comment: These tasks are carried out by existing municipal staff.